
You might run into a query that is showing parallel waits (CXPACKET, CXCONSUMER, etc). Typically, the parallel tasks executing are doing something like consuming CPU, waiting on IO, etc. If your parallel tasks get hung up waiting on something it will hold up the query execution as a whole.
Most monitoring methods will show the main execution task being stuck in some sort of CX* wait, but it doesn’t indicate if one of the parallel tasks is waiting on something out of the ordinary.
I recently ran across where the sys.dm_exec_requests wait_type column was reporting CXPACKET wait and was running much longer than usual. I had another environment that didn’t have issues. I compared the execution across the two environments. Both environments had the same execution plan and the same data volumes. Both environments had a parallel plan so the CXPACKET wait was expected. At this point I decided to dig deeper and see if the parallel tasks in the problematic environment were stuck in some sort of unexpected wait type. Typically, the parallel tasks will show up in CXCONSUMER waits, sometimes PAGEIOLATCH, etc… To see what waits the parallel tasks were in I ran the following query:
SELECT * FROM sys.dm_os_waiting_tasks WHERE session_id=54
The results of this are below:
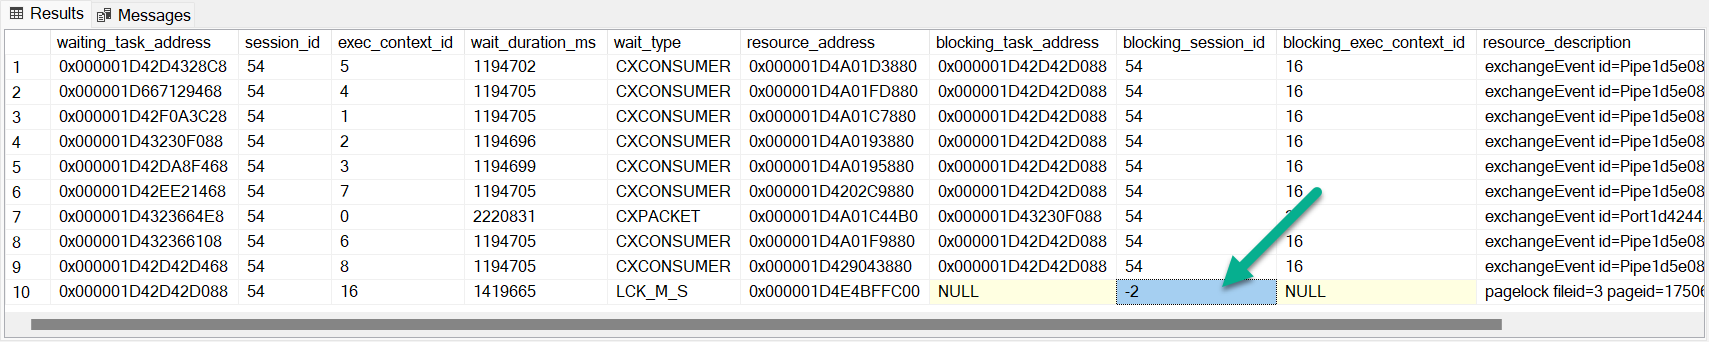
From this we can see 10 tasks that were in a wait. The task that sys.dm_exec_requests reports back is exec_context_id 0. All other tasks were in CXCONSUMER waits. The task of interest is the one showing a wait_type of LCK_M_S. This points to a lock being held by a negative session ID (-2). If you read a post I wrote a few years ago this indicates an orphaned distributed transaction occurred which is causing blocking.