
In this first of a 3 part post I’ll go over some ways to get accurate timing of query runtimes. This is geared towards the situation where you are making query tweaks in SSMS and want to quickly see an accurate runtime that your tweak resulted in.
I’ll start this post off by suggesting don’t rely on “Include Client Statistics”: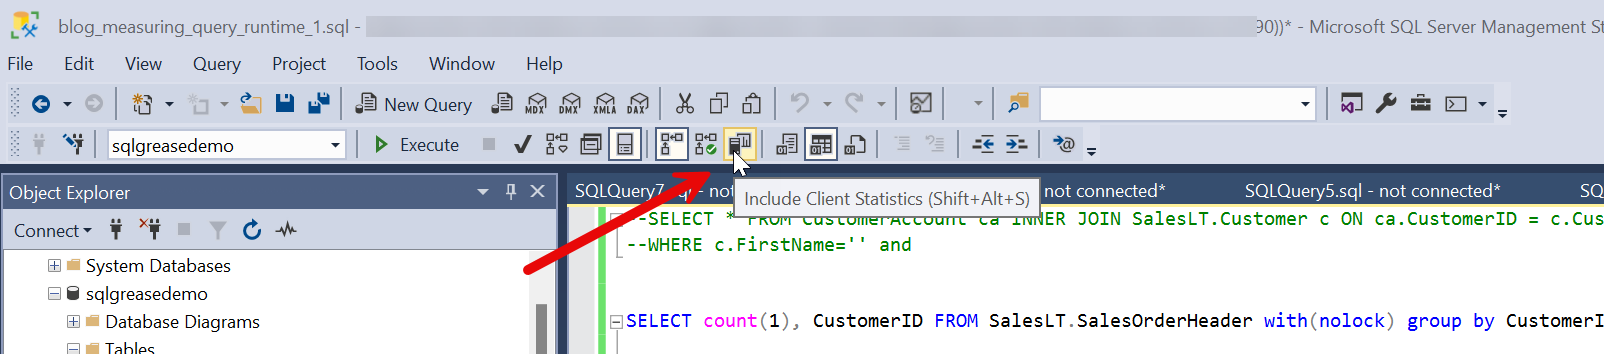
I’d also suggest you don’t rely on this: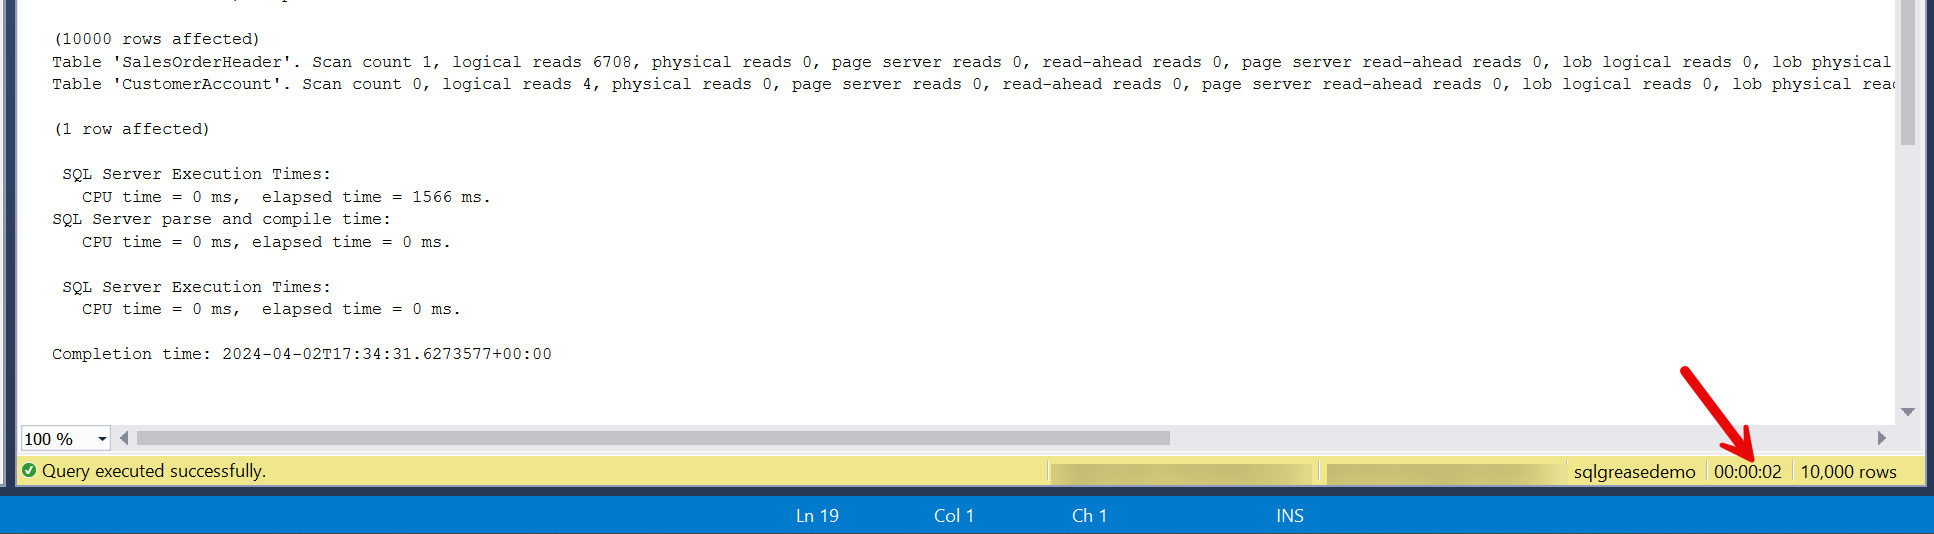
There are several better approaches. In this first post I will go over an approach I frequently use.
SET STATISTICS TIME ON/SET STATISTICS IO ON
This is probably one of the older approaches to timing a query in SSMS, but it works quite well and is quite easy to use. This doesn’t require much in regards to permissions. If you can run the query, you can get this info. In your SSMS session you’ll want to run the following prior to running any queries (this is per session so you’ll need to run it for each session you test in):
SET STATISTICS TIME ON

SET STATISTICS IO ON
After you do this you will receive additional information in the messages tab at the bottom of the screen in SSMS.
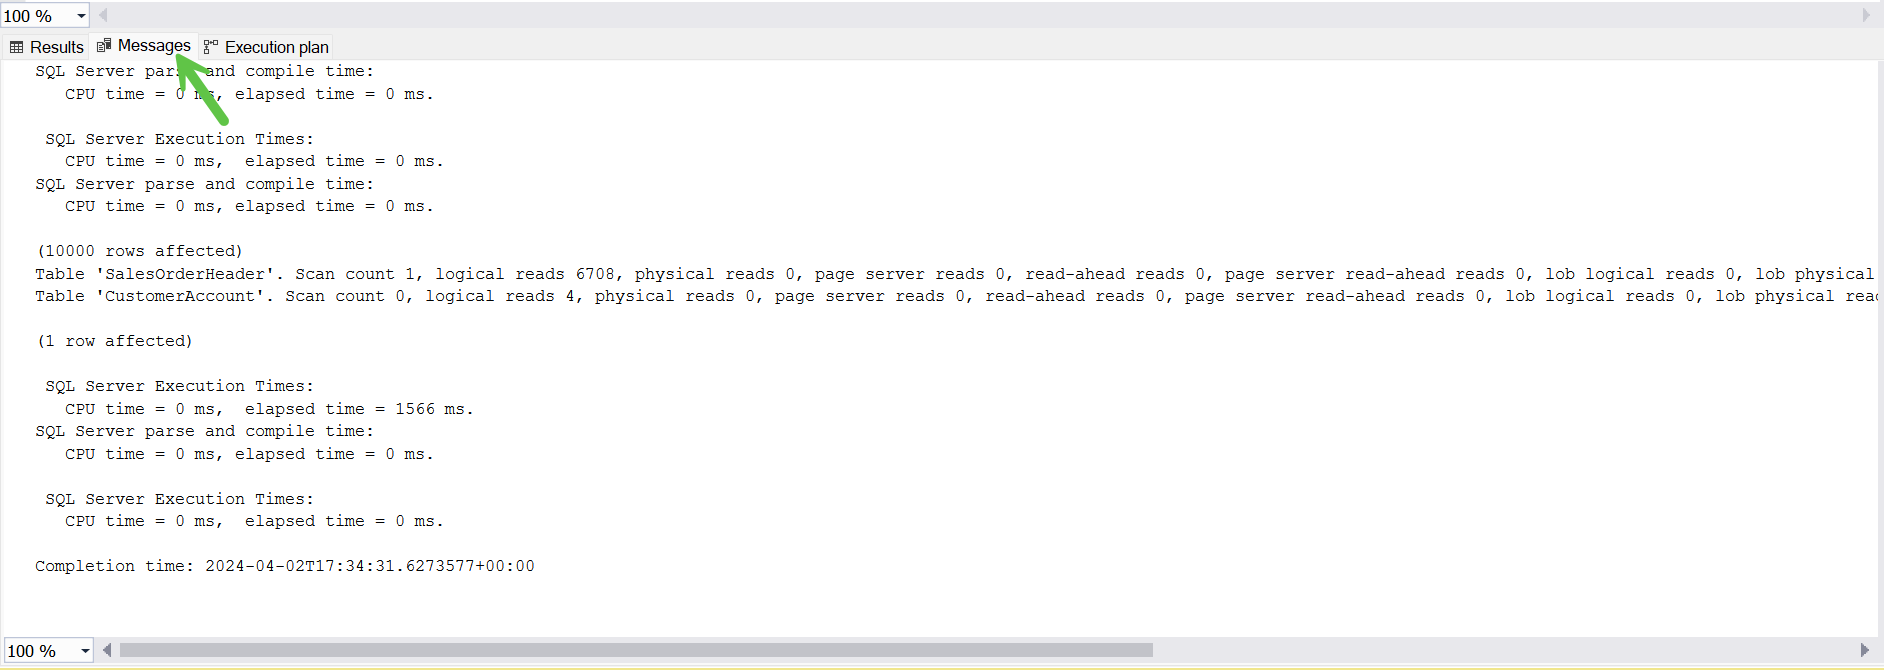
The timings displayed are measured at the server. You can see the amount of CPU time and the elapsed time of the query. The elapsed time will reflect any waits encountered while executing the query. For example, if the query ran into lock waits, IO waits, or network waits it will surface in the elapsed time. If you’re not familiar with waits I suggest you read my post on waits. In general, the CPU time will be less than the elapsed time unless the query has a parallel execution plan. In the case of parallel plans CPU time may be higher than the elapsed time.

The statistics IO output helps you spot where your query hotspots might be. Look for high logical IO’s. Compare that to the execution plan for the table where the high logical IO’s are indicated. That is likely a hotspot in the query that may need some tuning.

Don’t get overly concerned with the “Scan count” statistic. This doesn’t necessarily mean a table/index scan occurred. This can also be an indicator of an index seek.
They “physical reads” statistic will probably vary from execution to execution. This is the result of SQL Server caching data. If you are tuning this is not as much of a statistic to watch as the “logical reads” statistic. If your tuning efforts show fewer “logical reads” and less “CPU time” you are probably headed in the right direction.
Some of the other statistics IO stats that are worth mention. Read ahead reads seem to surface in very large scans. Usually not something I focus on too much while tuning. Lob logical reads are IO’s against large objects. These would be columns like VARCHAR(MAX), NVARCHAR(MAX), VARBINARY(MAX), or IMAGE. Usually not something that comes up in tuning too often, but this is worth focusing on more than lob physical reads if you find these are a significant source of slowness.
One other area to make note of is the parse and compile time of a query. Usually this is pretty negligible, but on rare occasion I’ve seen some really high values for this. Usually query plans cache so this is less of an issue with production workloads; however, if you’re tuning and a query and it is taking longer than expected to run you might want to check this.

Final notes
As usual these are tools I use when permissions are limited or I’m looking at an older version of SQL Server (prior to 2016). In my next post I will go into some newer ways to measure query runtimes from the execution plan.