
This is the second part of a three part post on measuring query runtime. In this post I’ll go over using Actual Query Plans in SSMS to view runtime information. This is available in SQL Server 2016 and later. Prior to this actual plans do not have these details.
To capture the actual query plan in SSMS click the “Include Actual Execution Plan” button.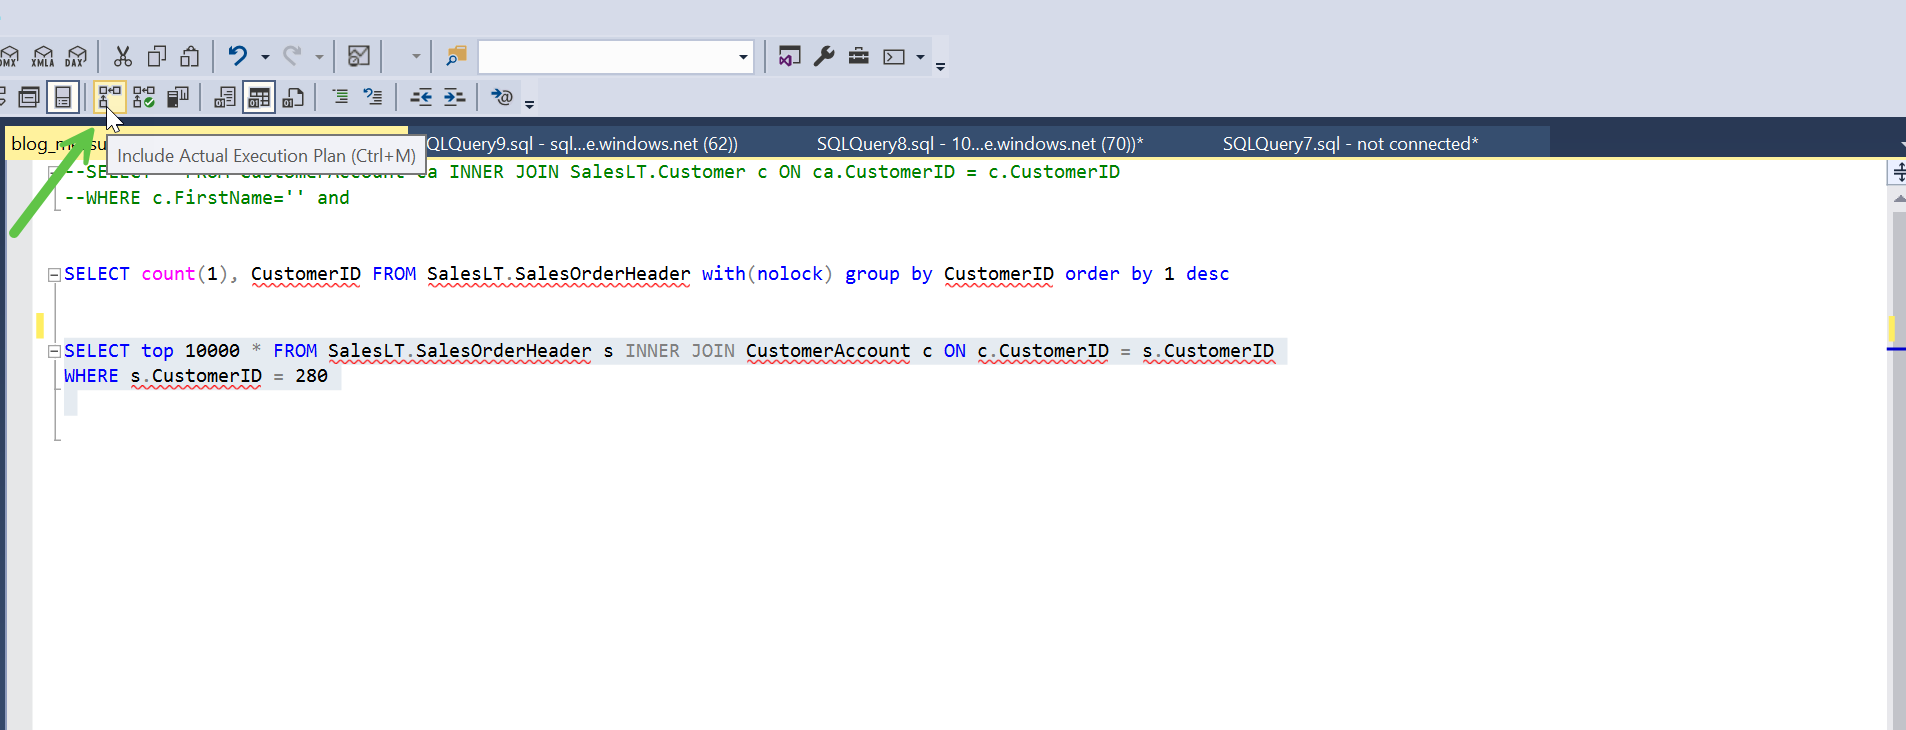
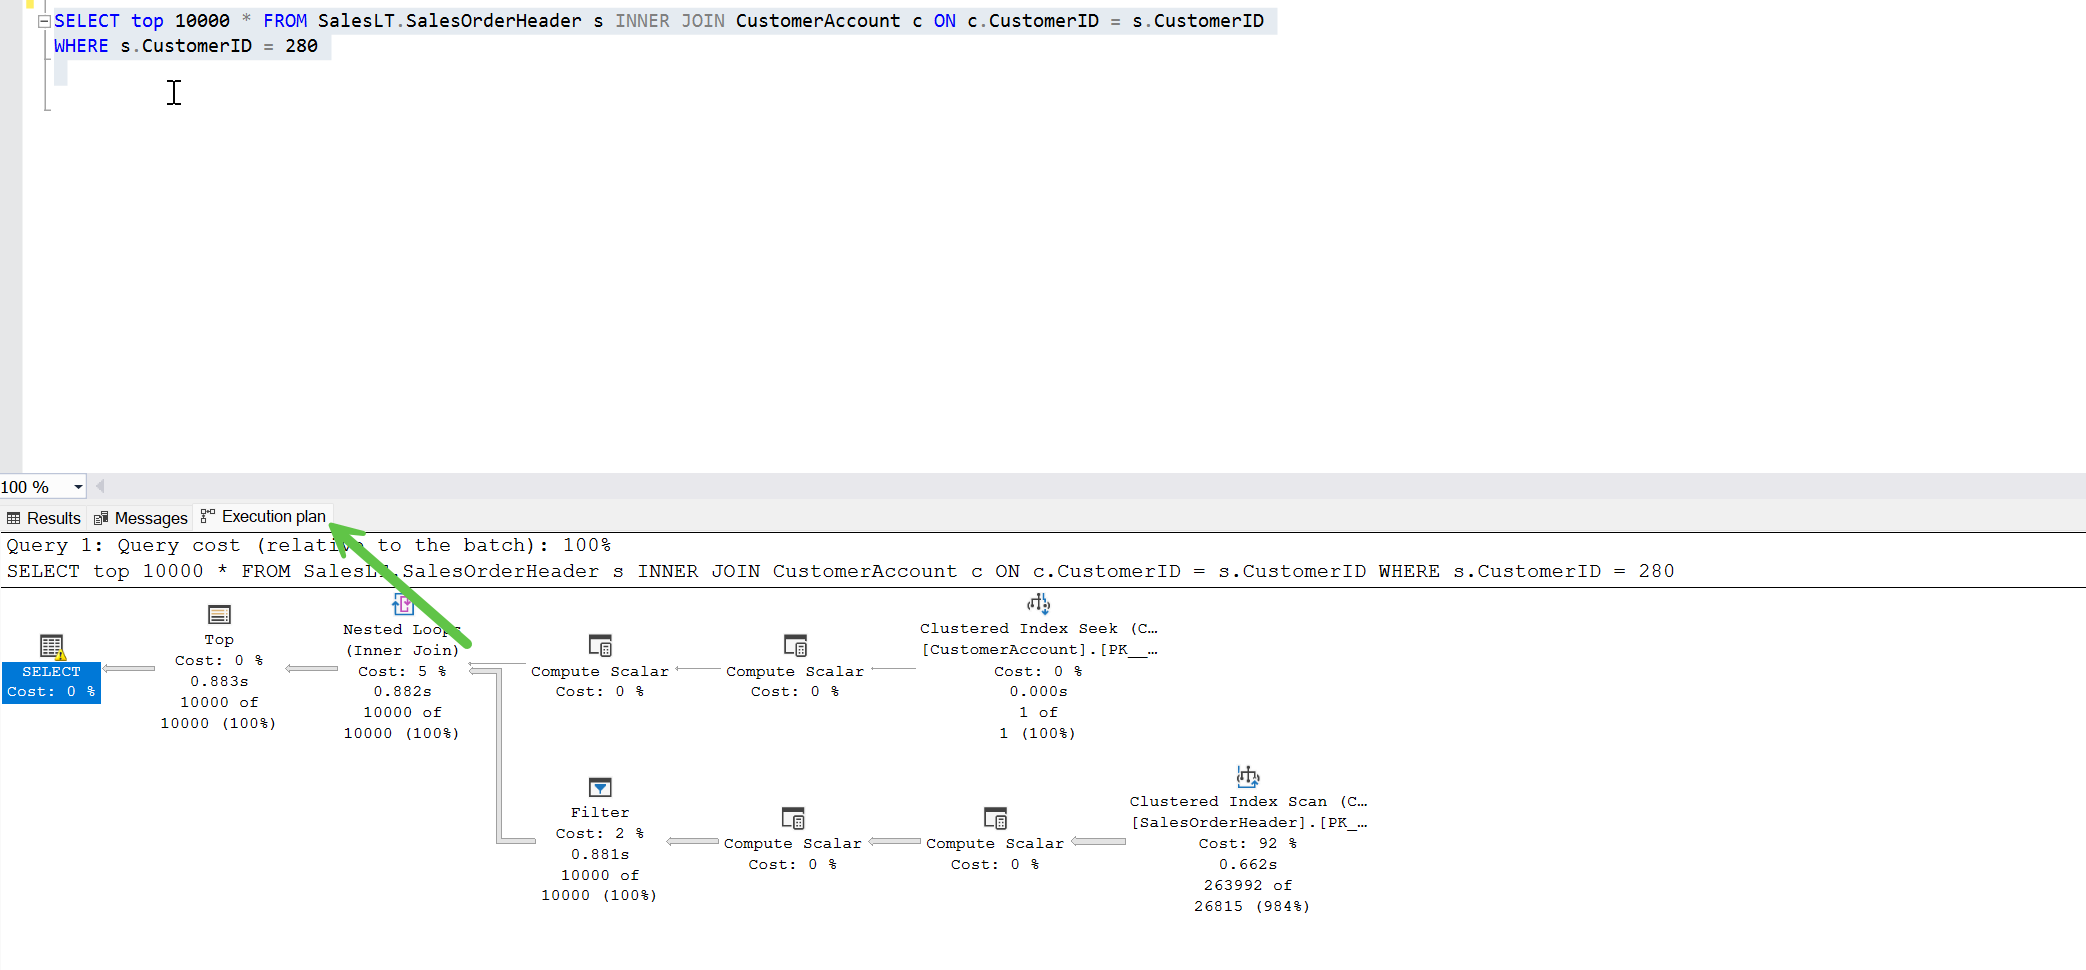
When you execute the query you will get an execution plan tab. Click on the tab.
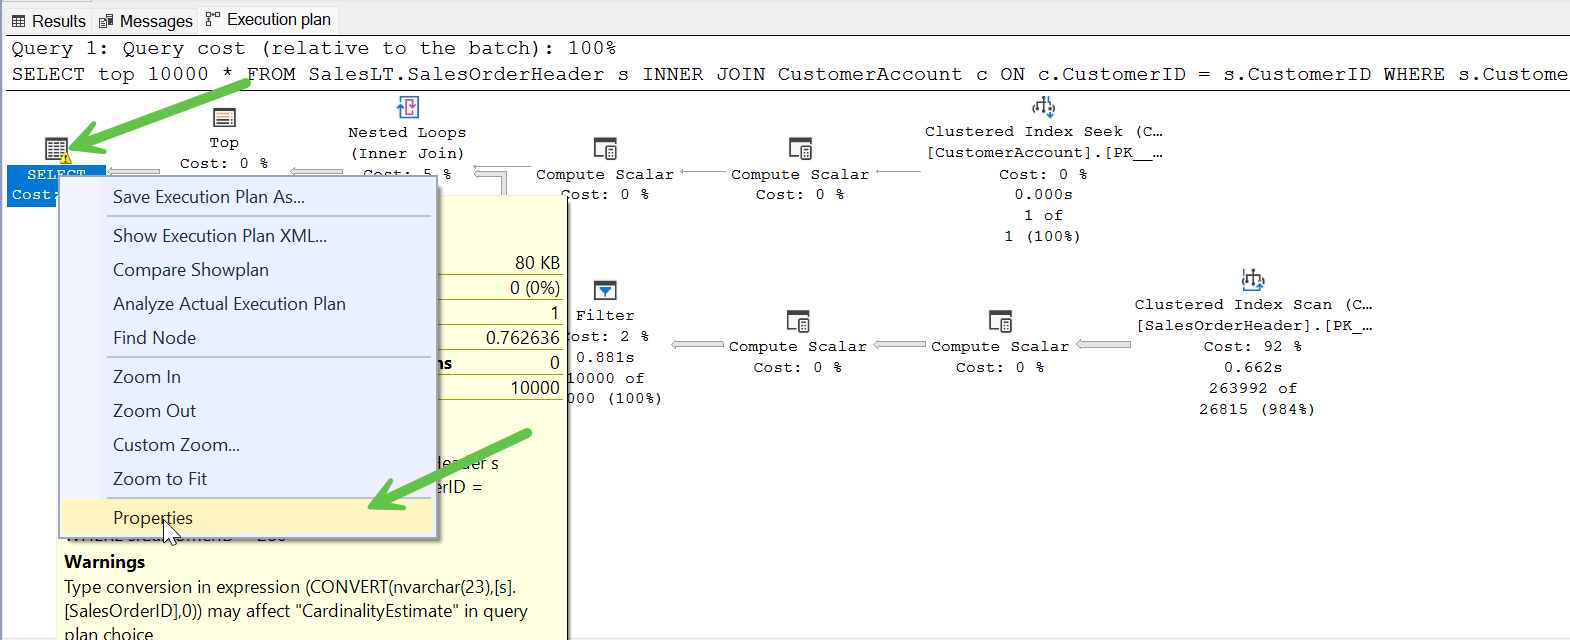
Right click on the SELECT/INSERT/UPDATE/DELETE/MERGE in the query plan and select “Properties”.
You will see a properties window pop up. To view the query time stats you can expand the “QueryTimeStats” tree. This shows the elapsed time of the query as well as how much of it was CPU time. These are displayed in milliseconds.
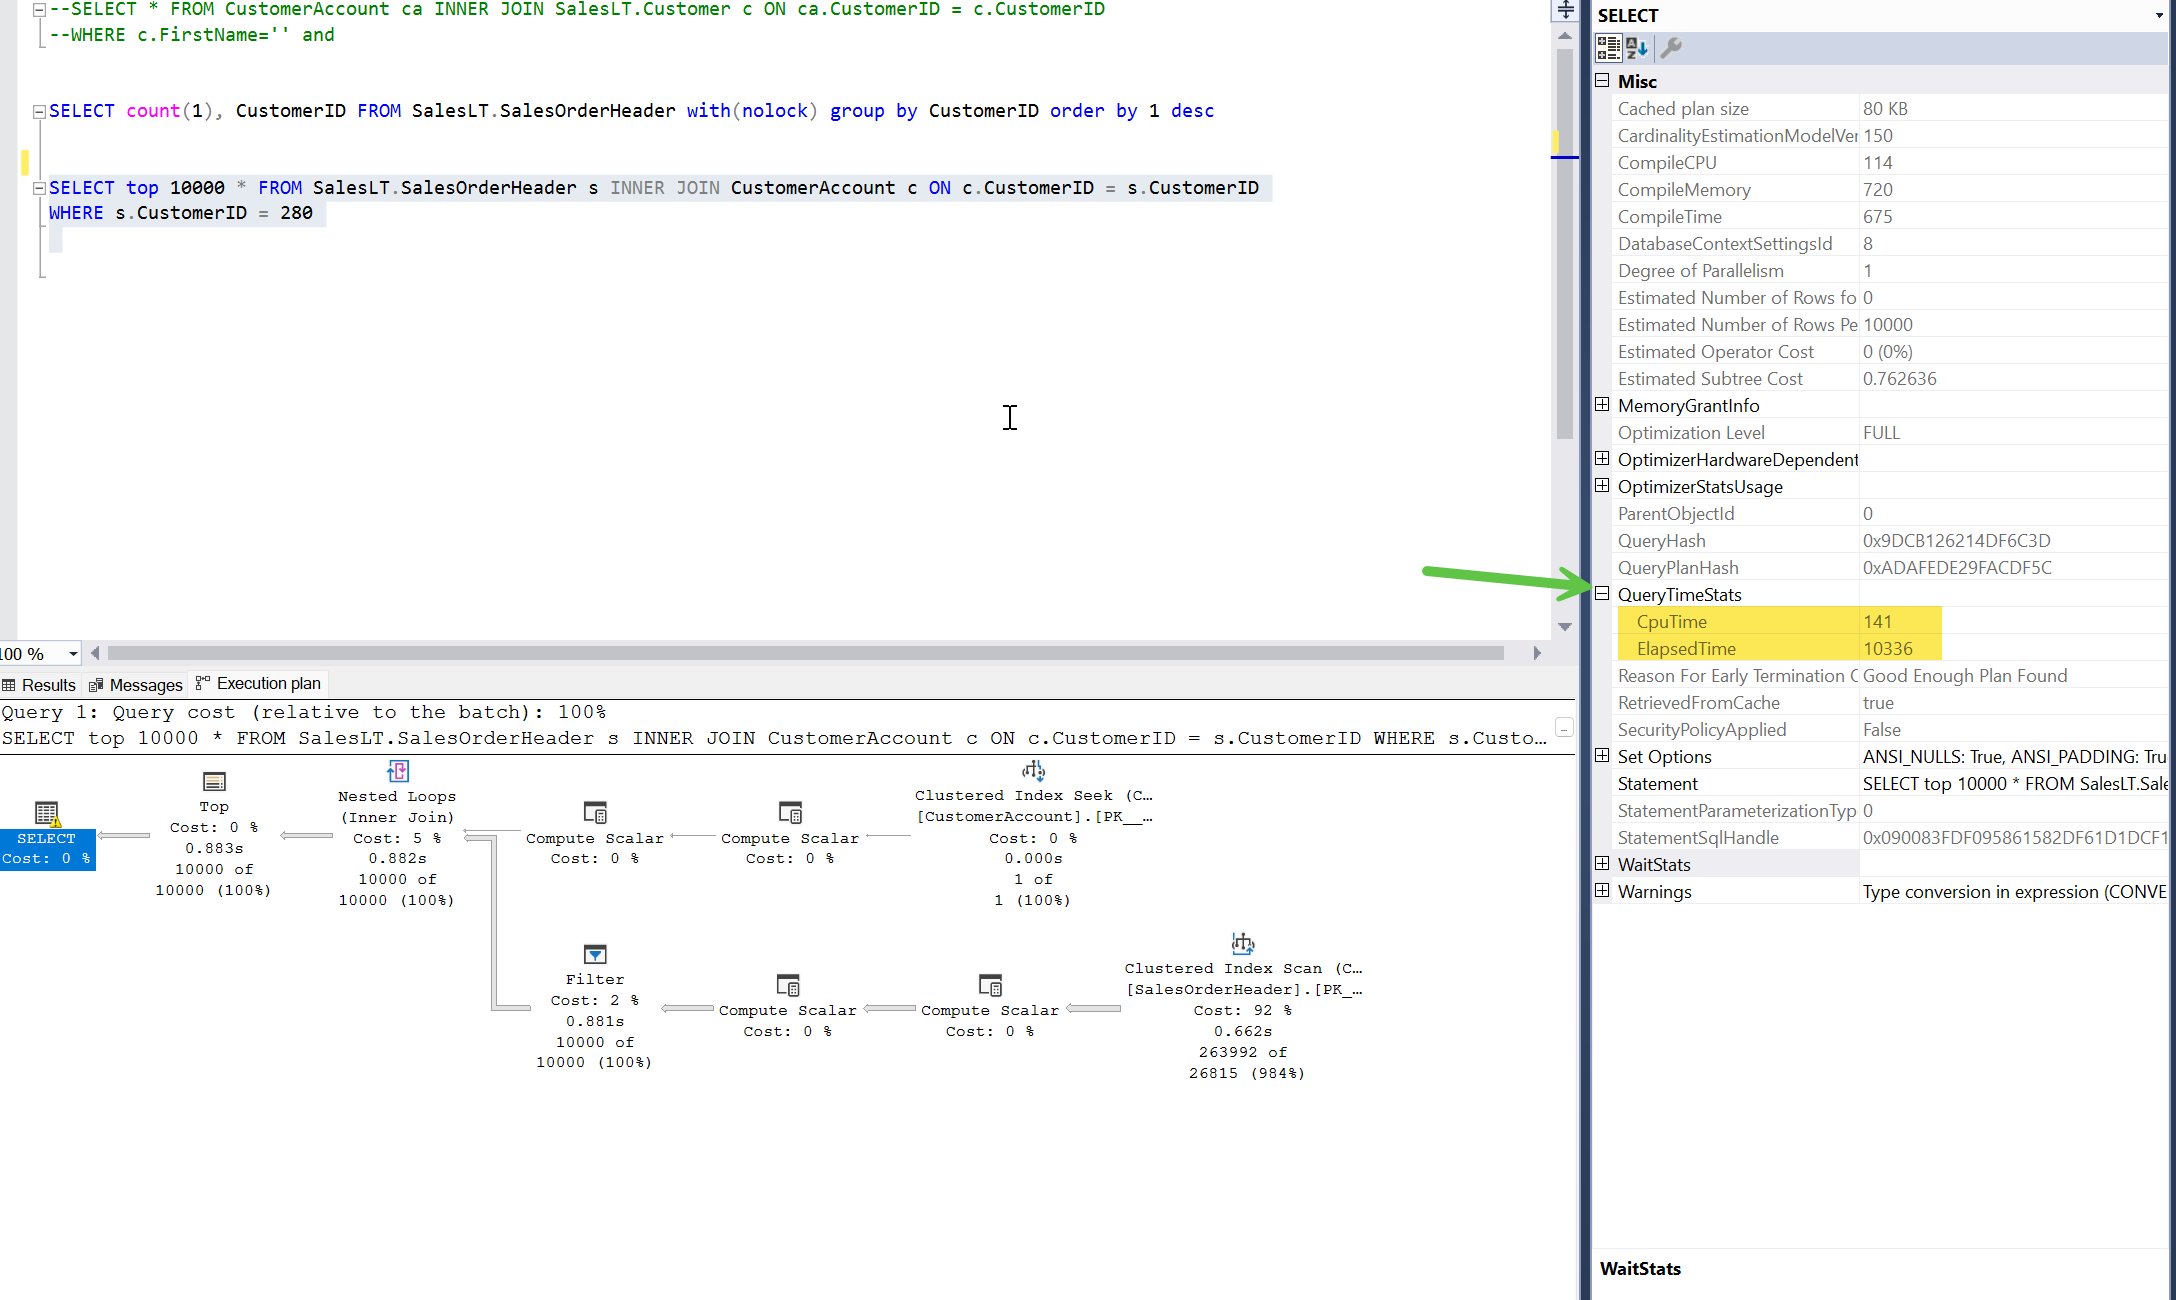
If you aren’t familiar with waits stats I suggest you read my post on wait stats. Note the CpuTime is 141 milliseconds. The ElapsedTime is 10336 millisconds. This raises the question of what was the query doing for over 10 seconds given it wasn’t using CPU. We can view details of this by expanding the WaitStats tree.
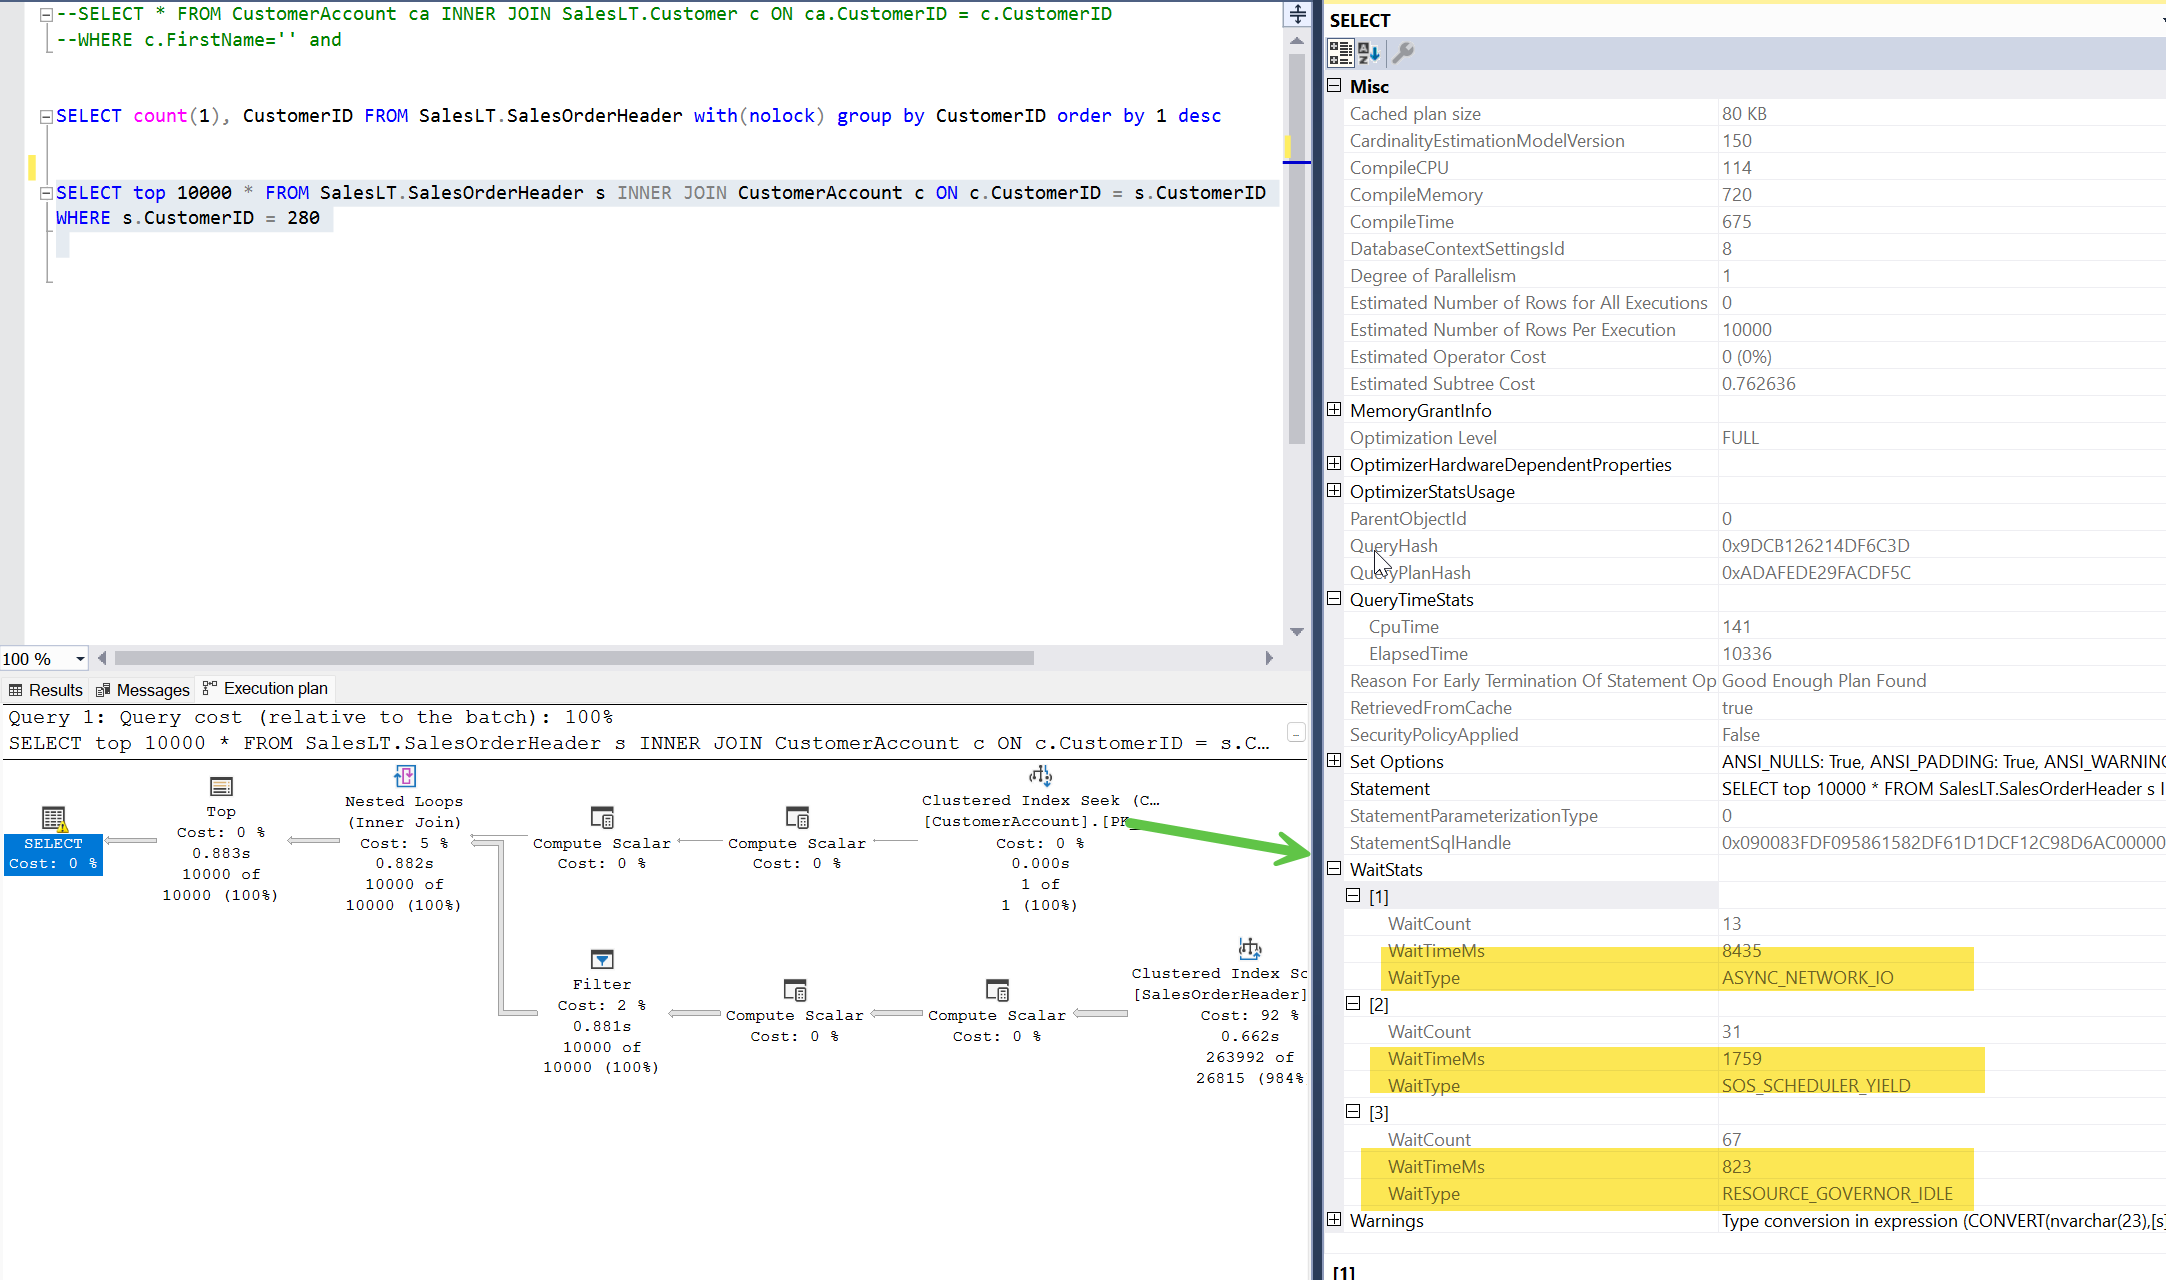
From this you can see that a majority of time was spent on ASYNC_NETWORK_IO wait. This is because I was testing on a not so great network connection; however, the query I was testing with was returning 10,000 rows. Next in line was SOS_SCHEDULER_YIELD (indicator of waiting on a turn at CPU). I’m using a fairly throttled down Azure SQL Database for this demo so SOS_SCHEDULER_YIELD is expected.
Final thoughts
This is a really big improvement over statistics time. The only catch to doing this is the query needs to complete to get this information. If you have a query that never completes you might want to consider a third party performance monitoring tool (ahem SQLGrease!). Had to add a shameless plug.
Nice post. How would capture elapsed times in the microsecond or nanosecond range? Thank You
When looking in properties these times are in milliseconds. I’ve been meaning to update this post to show that times within the operators of the execution plan are displayed as well (these are displayed in seconds though).