
Using standard DMV’s, it is difficult to get execution plans or query text from programs using cursors. You typically see an OPEN CURSOR statement, or a FETCH statement. This makes it difficult to identify what query was being run and what plan was being used. Query store actually tracks performance of both of these separately.
Below is the cursor query being used for this demo:
DECLARE CustomerCursor

CURSOR FOR

SELECT TOP 100000 CustomerID, FirstName, LastName, CompanyName, dbo.udf_SQLGreaseDemoScalar(CustomerID) FROM CustomerAccount ORDER BY CompanyName

OPEN CustomerCursor

FETCH NEXT FROM CustomerCursor

INTO @CustomerID, @FirstName, @LastName, @CompanyName, @SalesPerson

WHILE @@FETCH_STATUS = 0

BEGIN

FETCH NEXT FROM CustomerCursor

INTO @CustomerID, @FirstName, @LastName, @CompanyName, @SalesPerson

END

CLOSE CustomerCursor

DEALLOCATE CustomerCursor
Both the OPEN CURSOR and FETCH NEXT calls appear in query store as the declaration of the cursor. Below is a screenshot from a query I ran against query store showing the query text, count of executions, query id, and average duration. Note the DECLARE CustomerCursor text showing up in query store (as opposed to OPEN or FETCH NEXT):
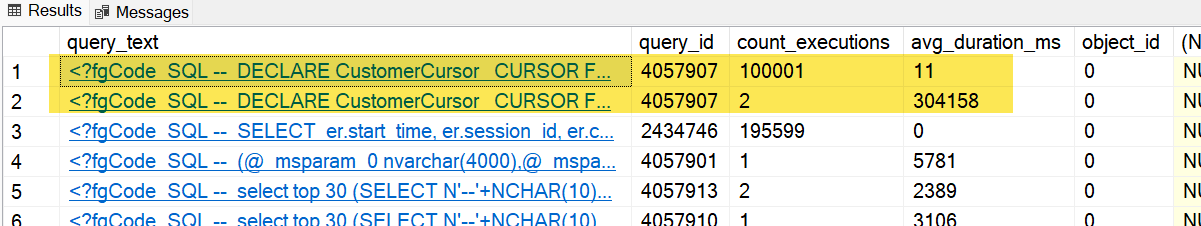
Also note within the same timeframe this query has the same query_id listed twice (4057907). One of these entries is for the OPEN, the other of these entries is for the FETCH NEXT. While I have not been able to find a clear indicator as to which of these is associated, it’s probably safe to assume the entry with low count_executions (2) is probably the OPEN. The count_executions (100001) with the higher count is most likely the FETCH. Another tip off is the OPEN call likely takes longer as noted by the avg_duration_ms.
Final Thoughts
Sometimes FETCH statements don’t appear in query store. They won’t show up if the FETCH is really quick. I artificially slowed the FETCH down by adding a call to a scalar UDF to the selected columns of the demo query. This helped surface it for the purpose of example.