
Since early SQL Server versions Page Life Expectancy (PLE) was used as a benchmark of performance, or indicator of a problem. PLE is a performance counter that can be misleading. PLE is a measure of how long pages have been cached in memory. If you use a performance monitoring tool that showcases this metric your tools are likely dated.
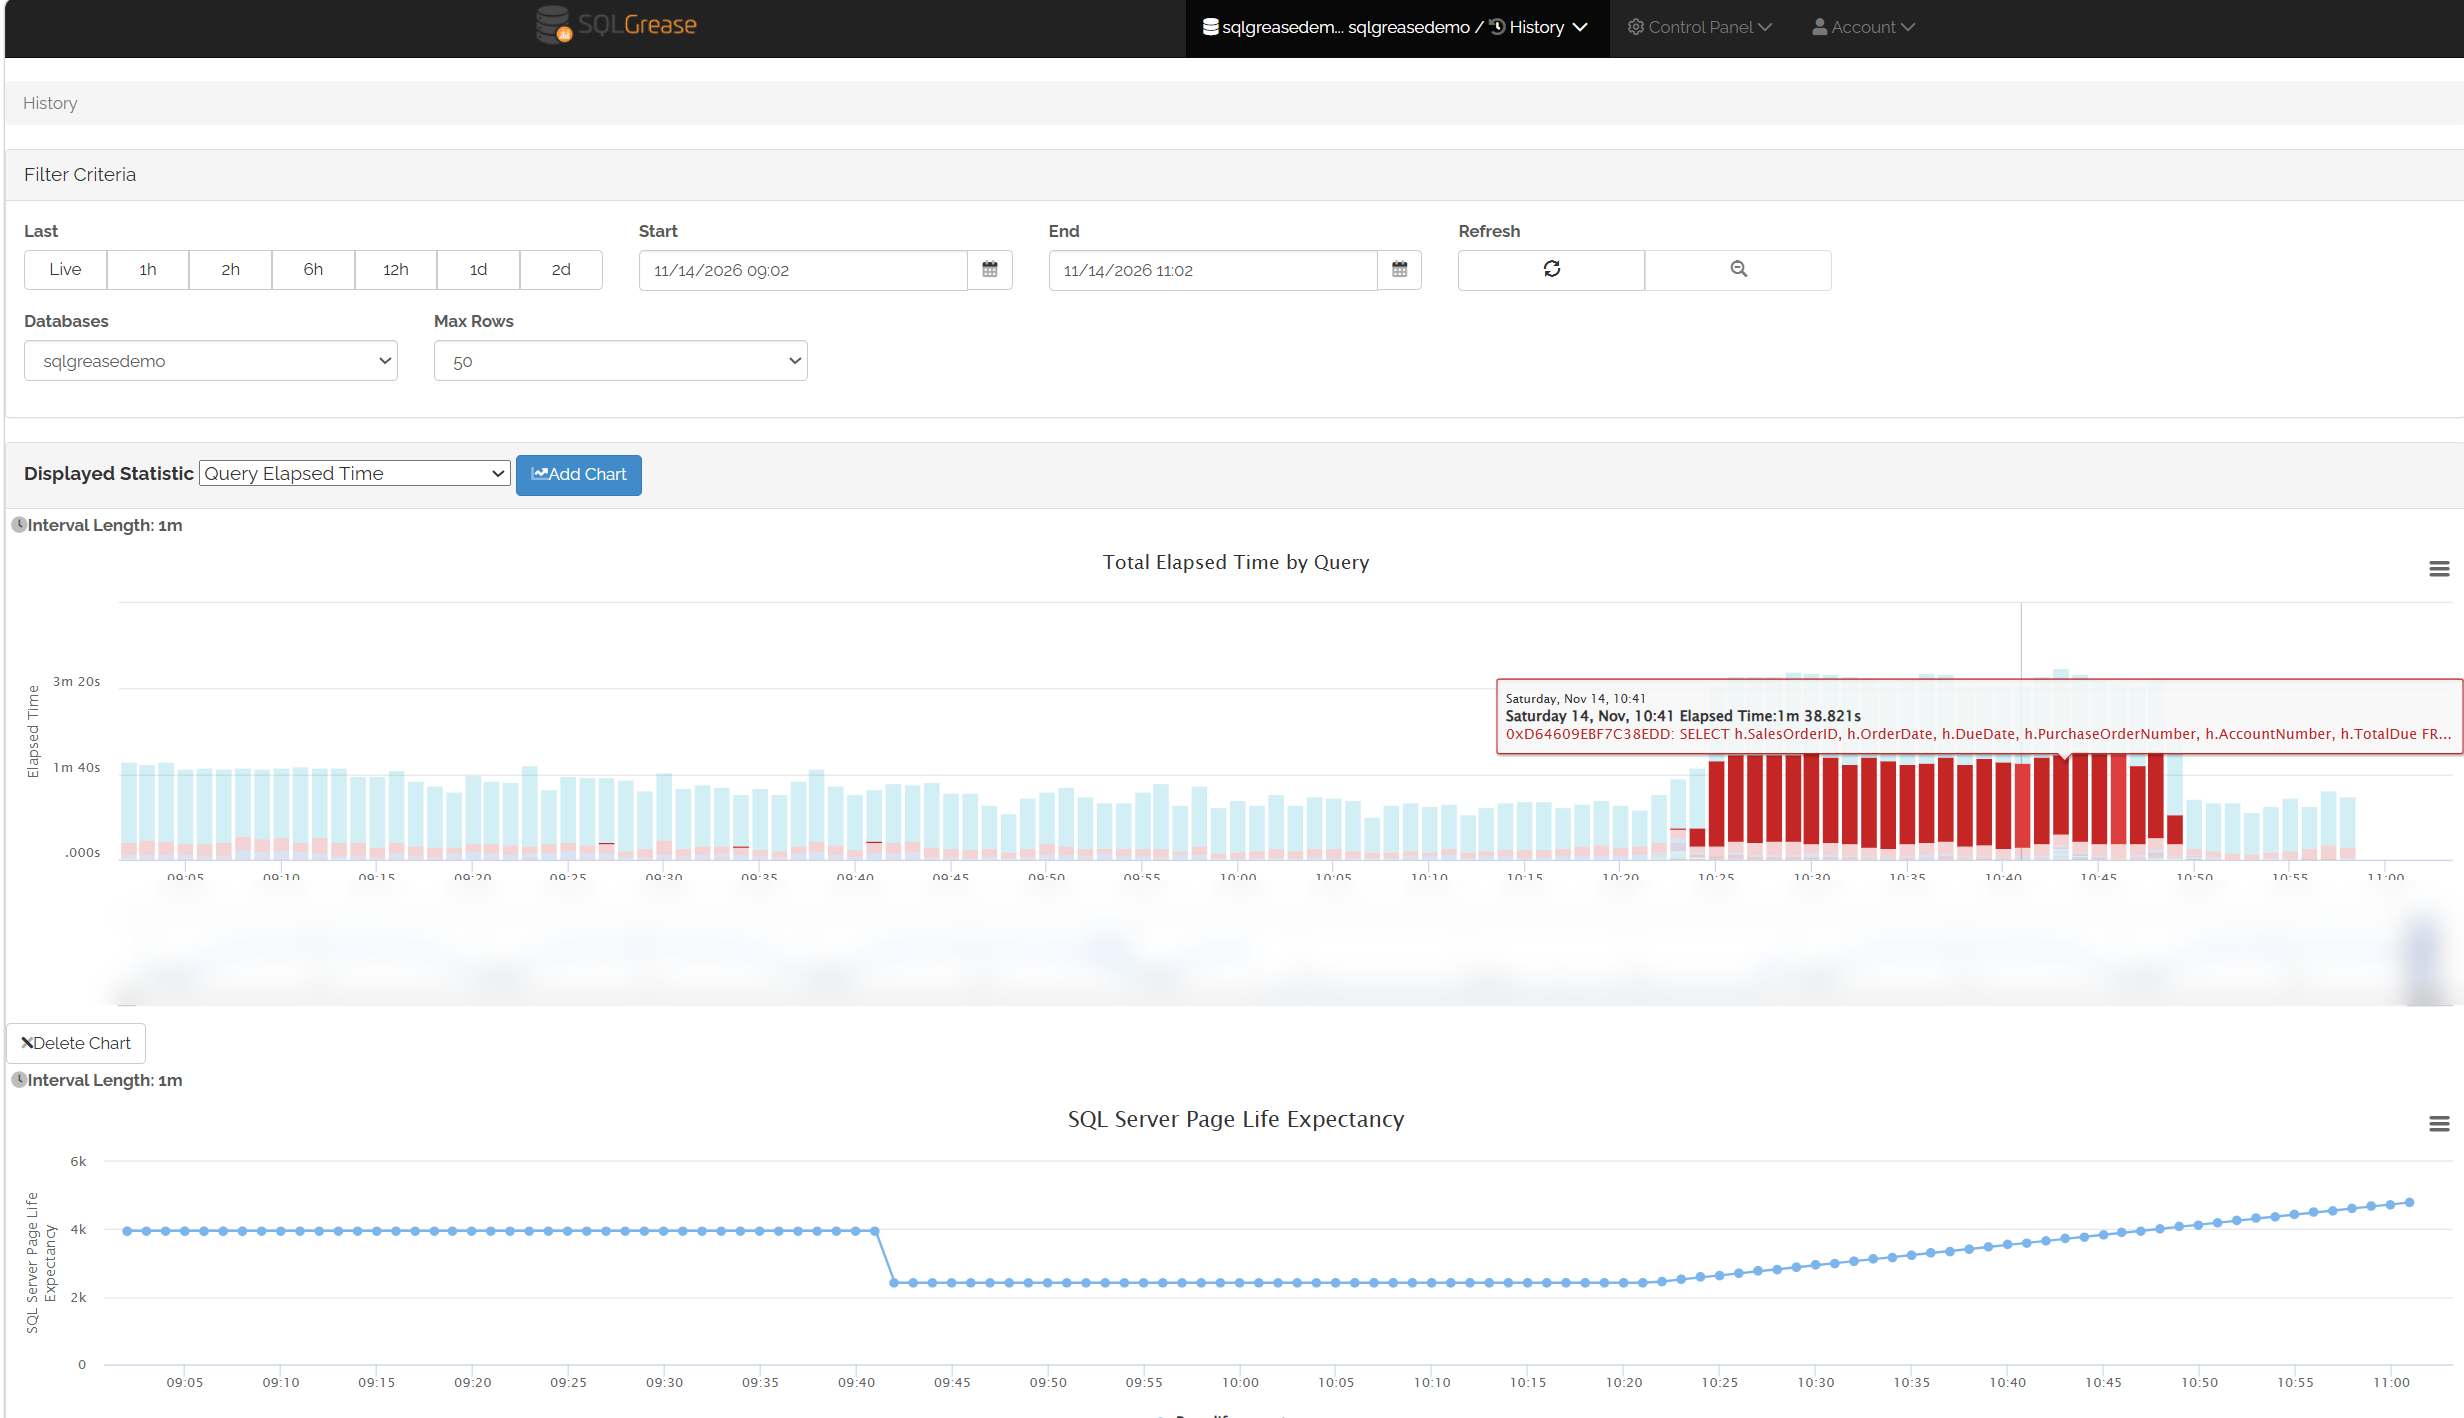
Below is a chart of a real performance problem where PLE increased while the issue was occurring. Not a good indicator of a problem.
How to monitor memory pressure instead of PLE
You can focus on wait statistics. Ideally, looking at high waits on PAGEIOLATCH_* or RESOURCE_SEMAPHORE are indicators of memory pressure. You can use query store to check if these are showing up at the top of your waits. I know someone will chime in with checking sys.dm_os_wait_stats; however, it doesn’t show if it is a foreground wait affecting performance. It’s best to use query store and look at sys.query_store_wait_stats.
Back to perfmon
Are your IO throughput numbers within a reasonable value? You can use perfmon to monitor logical disk\avg disk secs/read, logical disk\avg disk secs/write and compare those values to disk reads/sec and disk writes/sec. I’ve seen some really crazy things happen with virtualized environments where there were throughput bottlenecks introduced by things like virtualized controllers. This became apparent when failing over to replicas. Not a good performance tuning solution, but it at least gets things rolling again.
Also look at memory grants pending. These will usually show up with show up when you hit RESOURCE_SEMAPHORE waits.
Final thoughts
Maybe throwing hardware at the problem makes sense sometimes. It’s my last resort, but when something is tuned as well as it can be hardware can fix problems.